Welcome to wziep.com!


Categories
Welcome to wziep.com!


category: Energy Management System


General
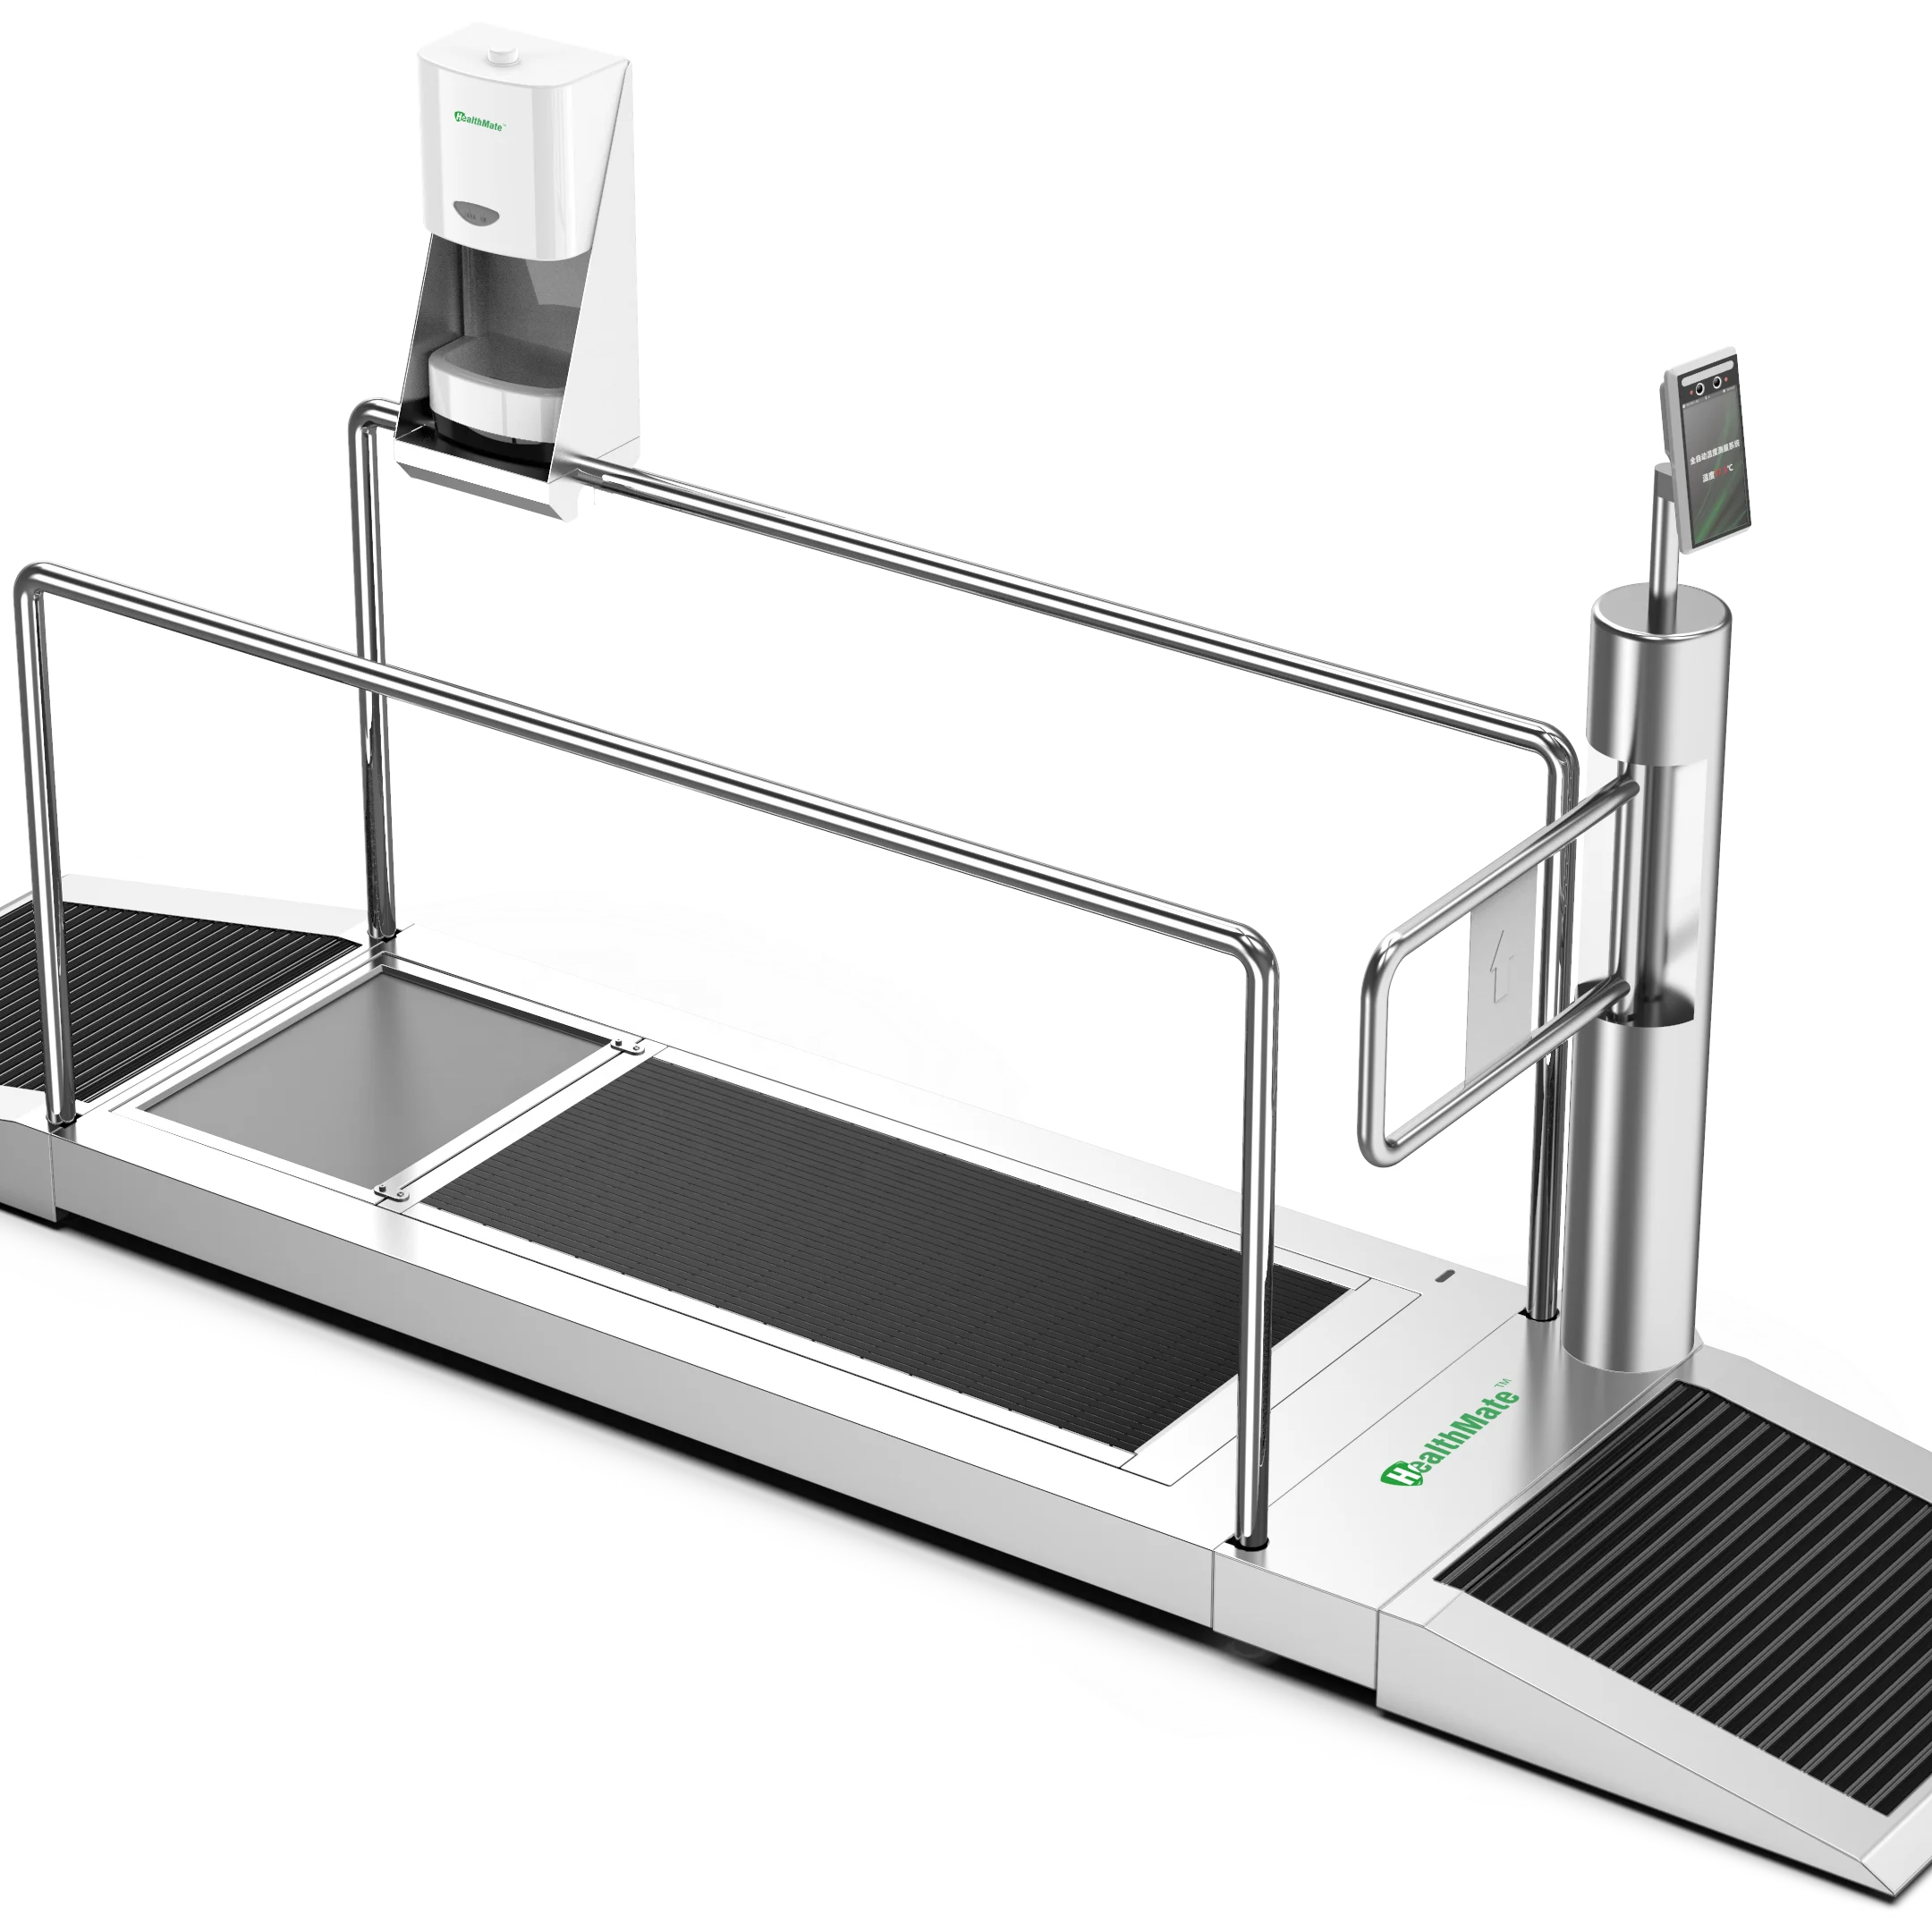
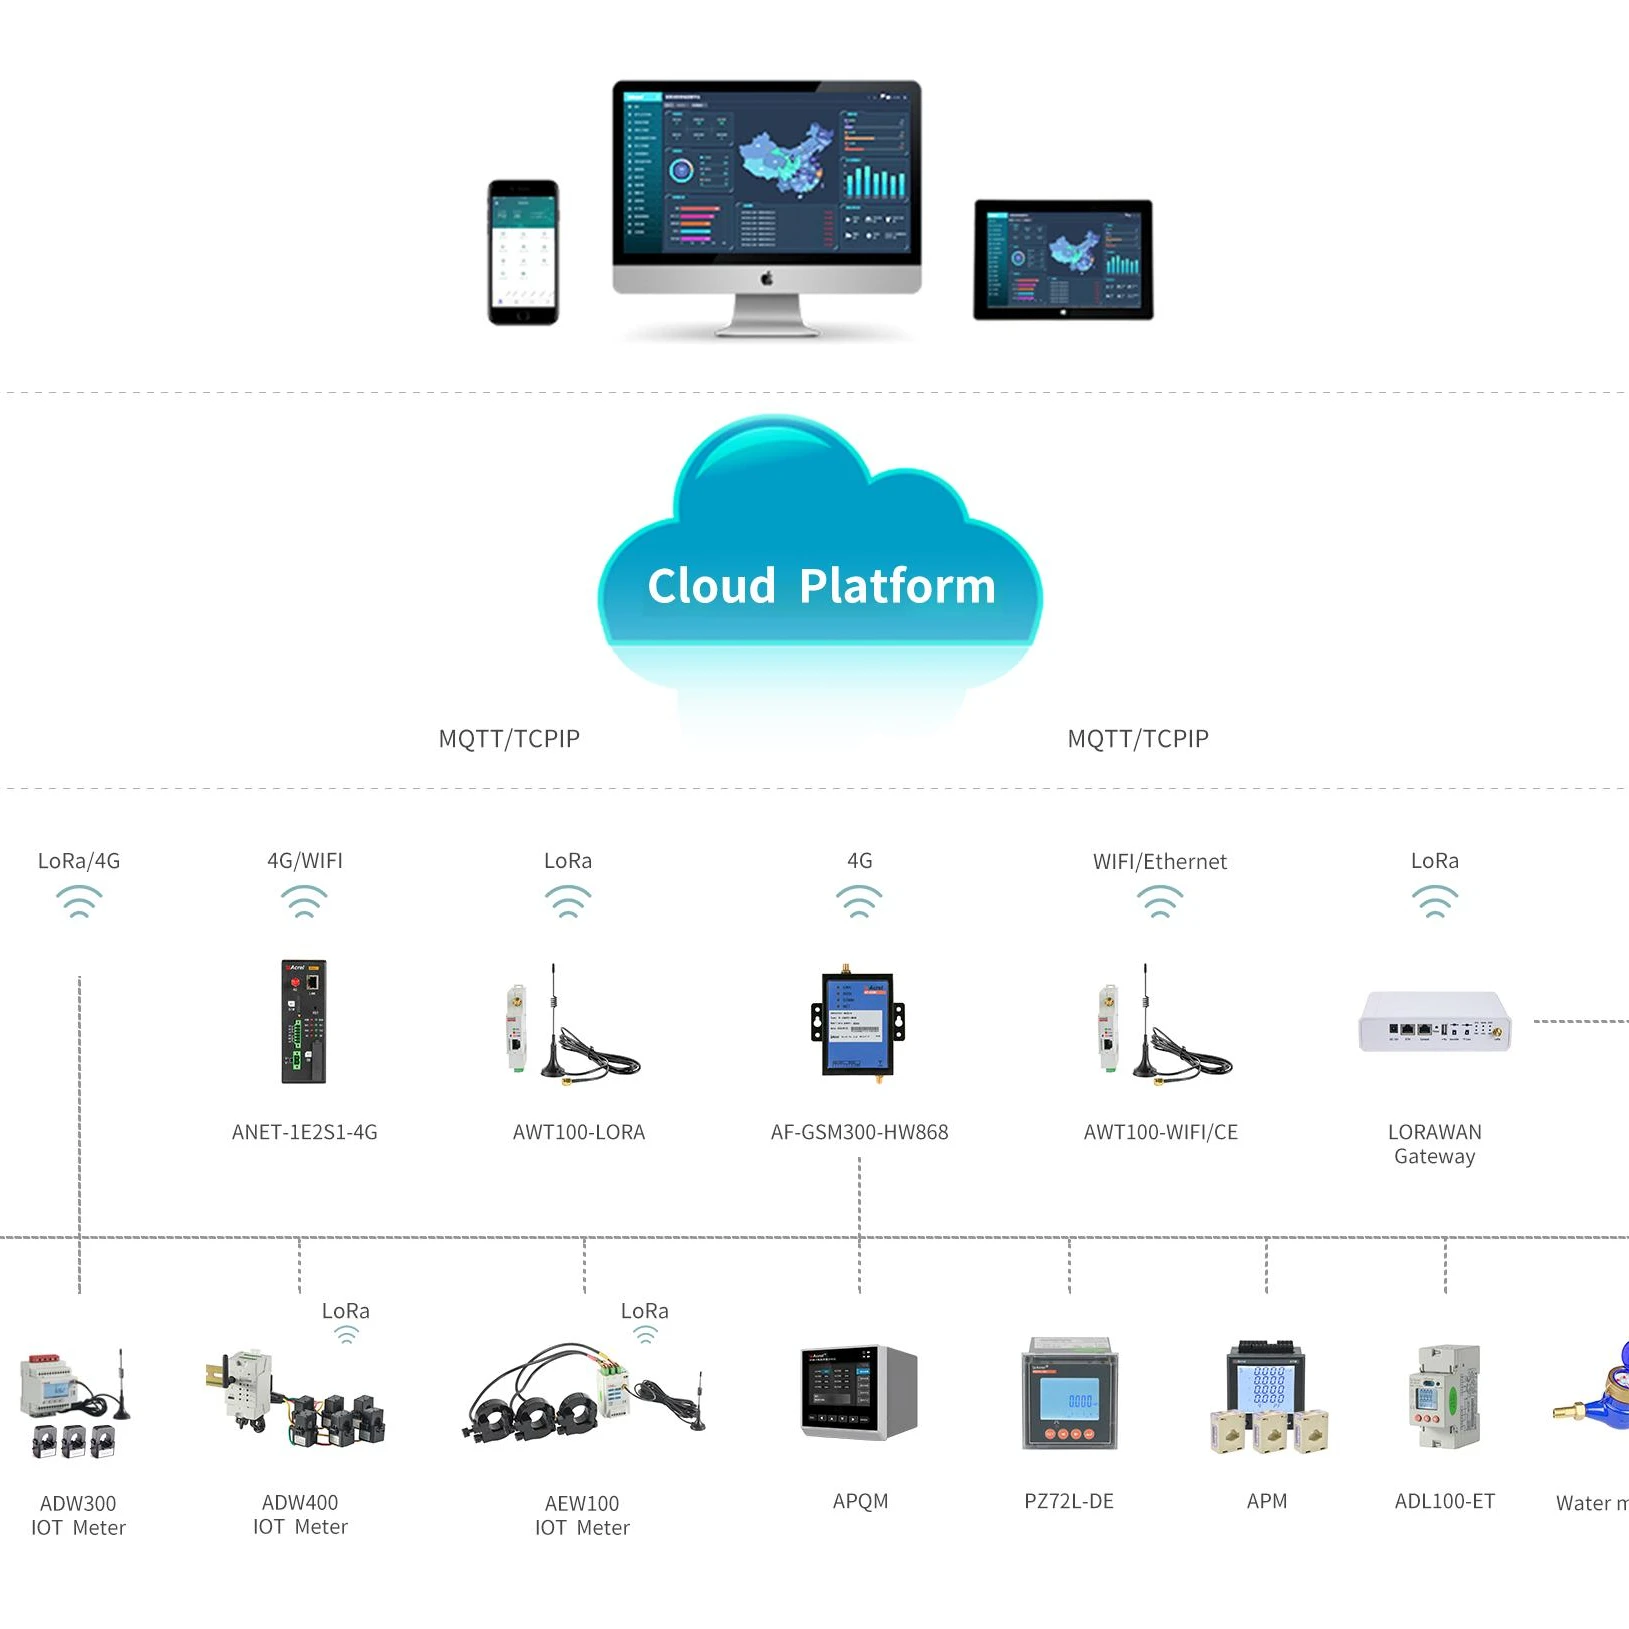
Acrel IoT EMS is a centralized online platform for connecting all acrel networking products. Acrel IoT EMS offers unified access, monitoring and control capabilities, which saves time and allows you to oversee your whole networking fleet. Acrel IoT EMS can be used in substation,building,telecommunication base station,industrial energy consumption,intelligent lighthouse,operation and maintenance of power , and so on.
If your acrel device is on IoT EMS, it can be used to generate remote access links to equipment that is connected to a private router network thus granting remote access to other equipment.Once an alarm event occurs,within a few seconds, relevant alarm and event information will be quickly pushed through the APP to notify relevant person.
Appearance
I.Login Page
Users Open the IoT website with Google Chrome or Firefox, the URL is http://iot.acrel-eem.com/. The login interface is as shown in Fig. 1-1.
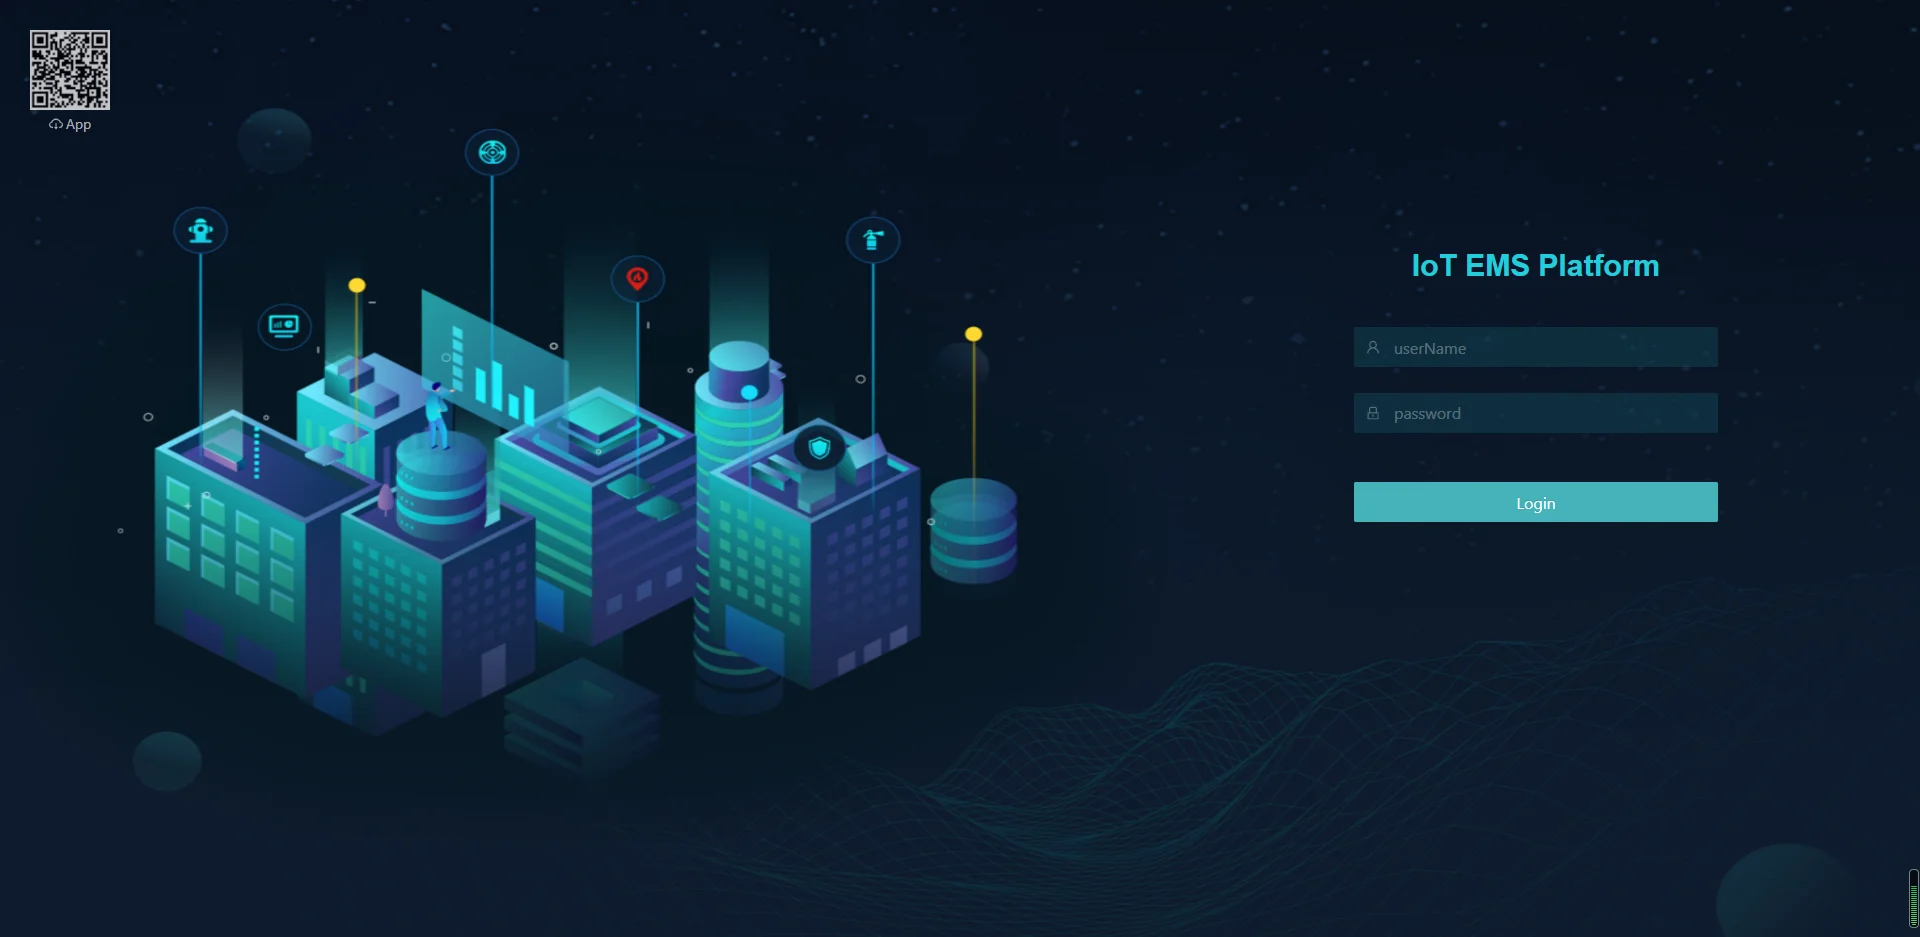
Fig. 1-1 Login Interface
I.Home Page
After successful login, users enter the home page firstly, as shown in Fig. 2-1.It can provide device status, event list, device alarm information and energy statistics.
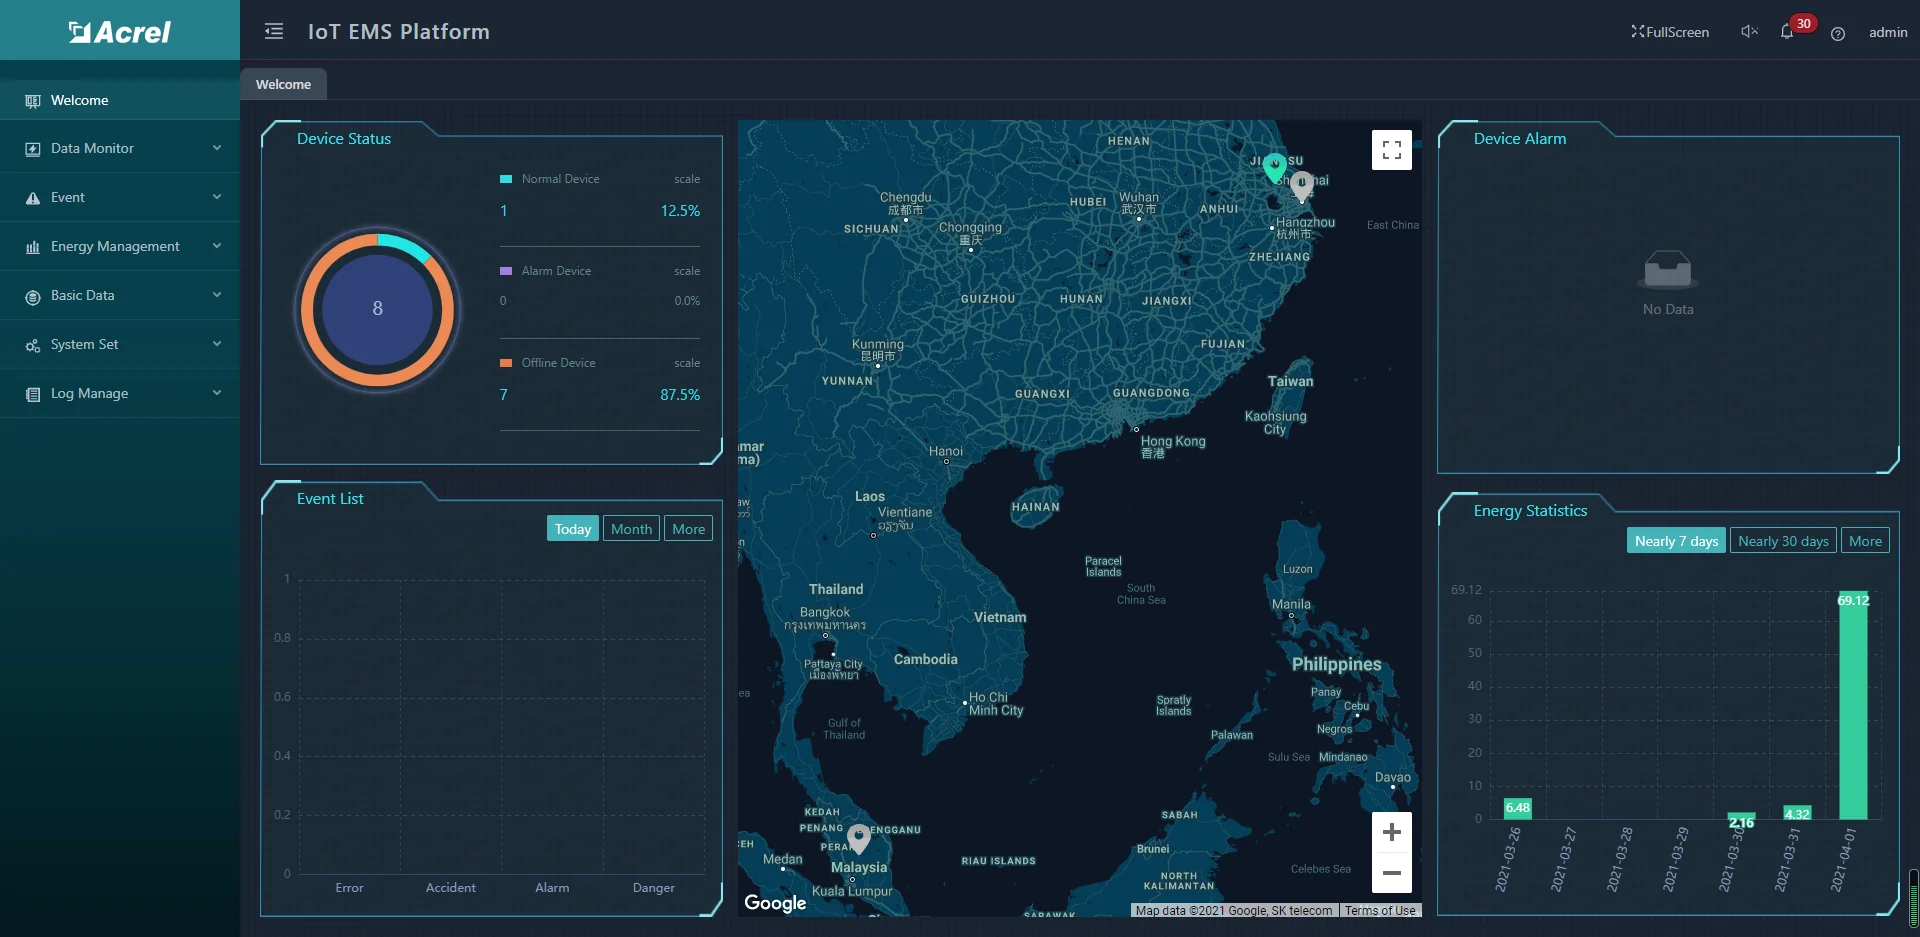
Fig. 2-1 Home Interface
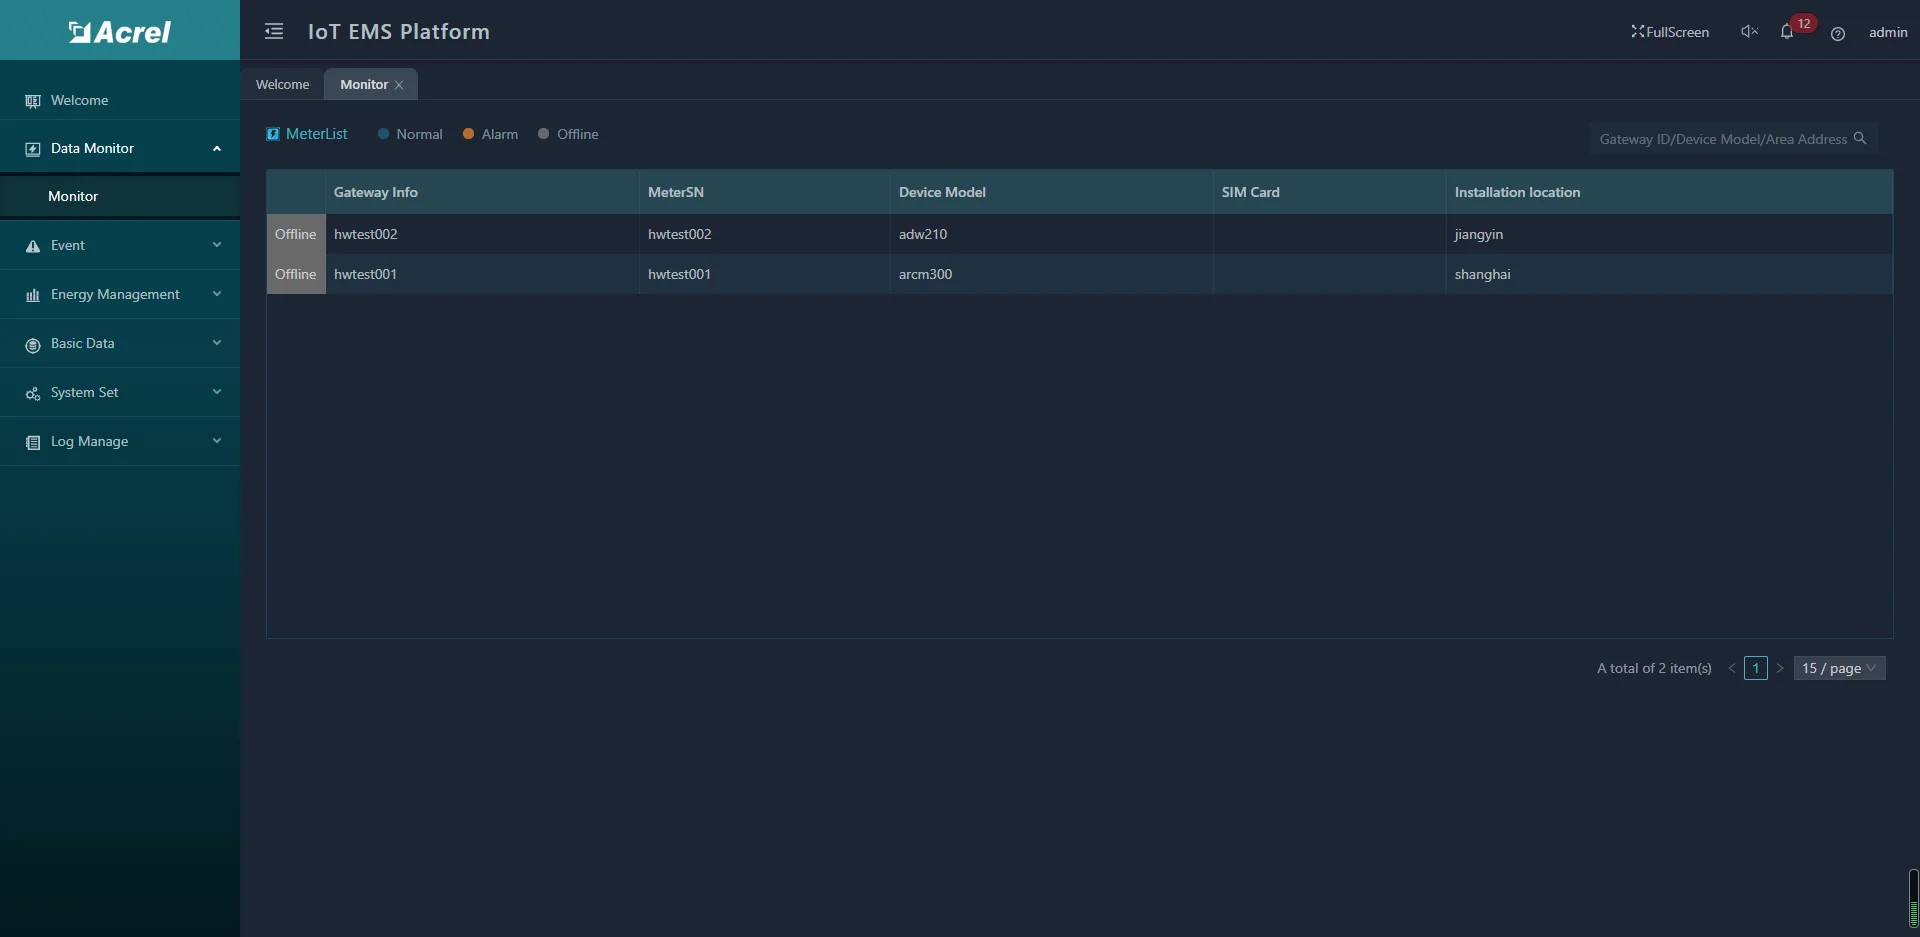
3.Data Monitor
The data monitor shows all the devices, and you can search the device what you want with Gateway ID, Device Model, Address. Every device has three states, including normal, alarm and offline. The data monitor interface is as shown in Fig. 3-1.

Fig. 3-1 Data Monitor Interface
Click the meter in the meter list to enter the meter details page, which shows the real-time data, history curves and alarm info.
The real-time data shows the real-time data of all the electrical parameters. If there is an alarm, the corresponding electrical parameter will turn red. The real-time data interface is as shown in Fig.3-2.

Fig.3-2 Real-time Data Interface
Below the real-time data is the history curve, which is the current data curve the selected electrical parameter by default. And you can select the history date to view the history curve.The history curve interface is as shown in Figure 3-3.
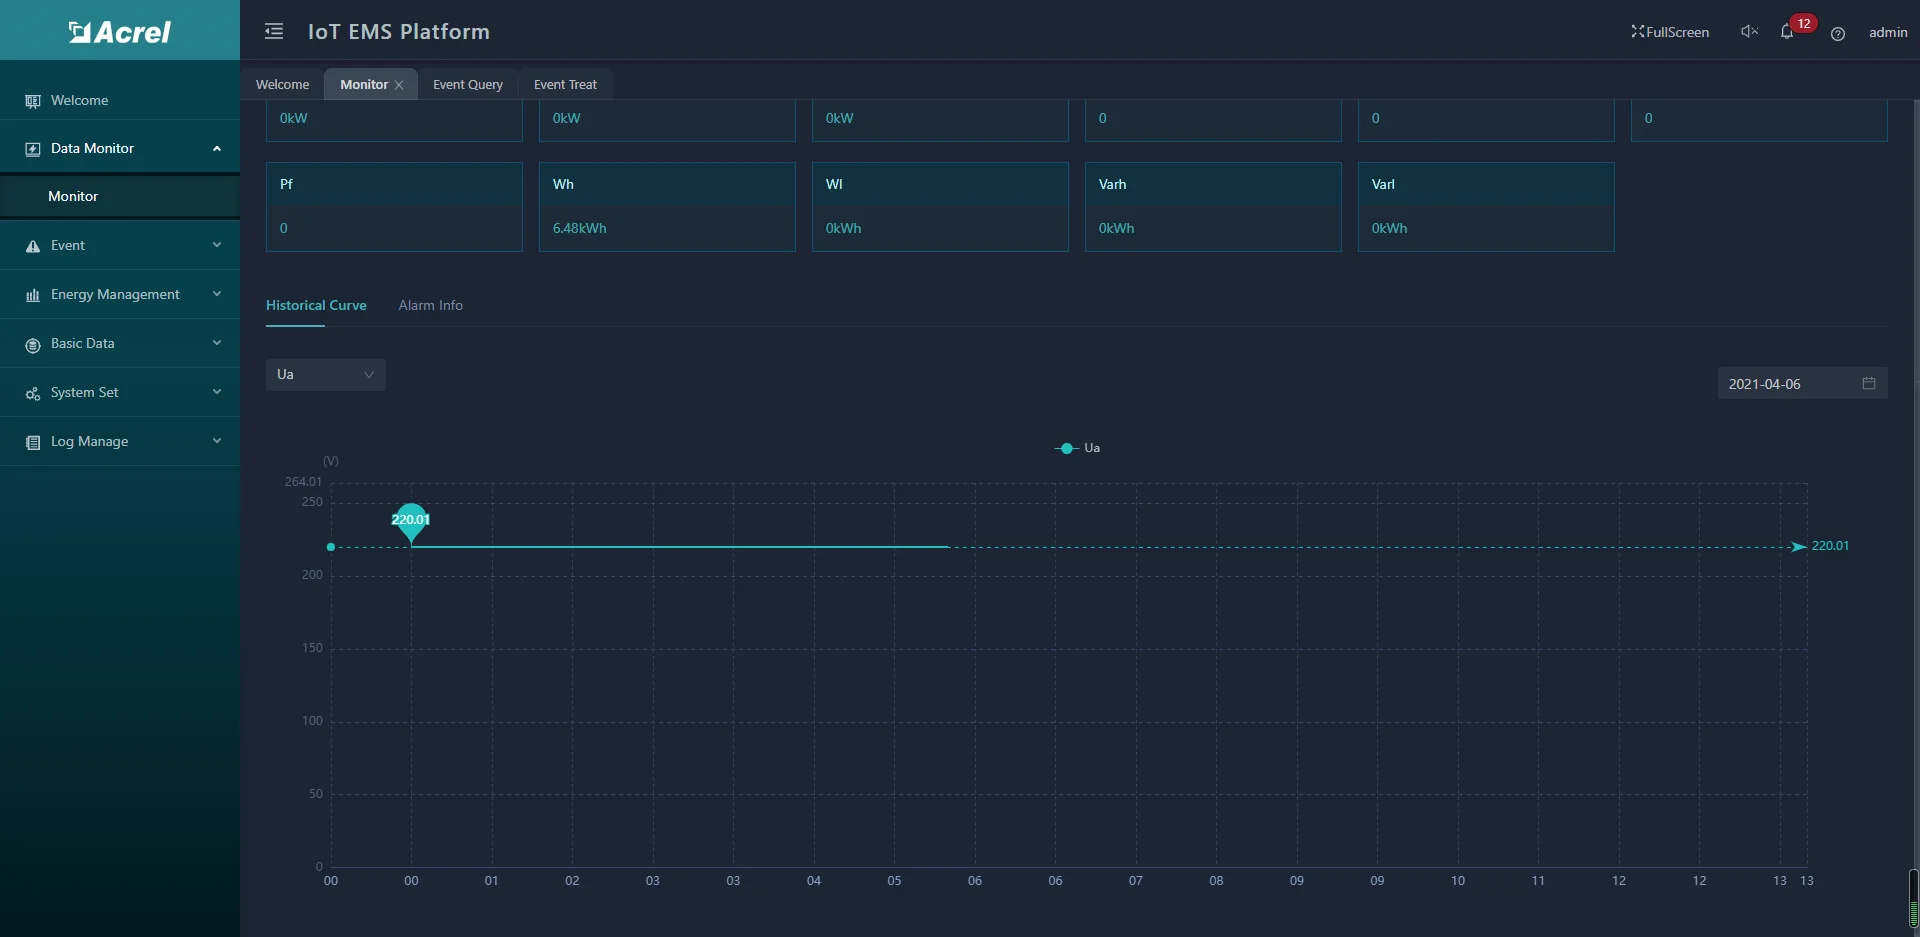
Fig. 3-3 History Curve Interface
The tab next to the history curve is the alarm info which shows all the alarms uploaded from the meter. The alarms can be divided into tow states: Untreated, and treated, as shown in Fig. 3-4.
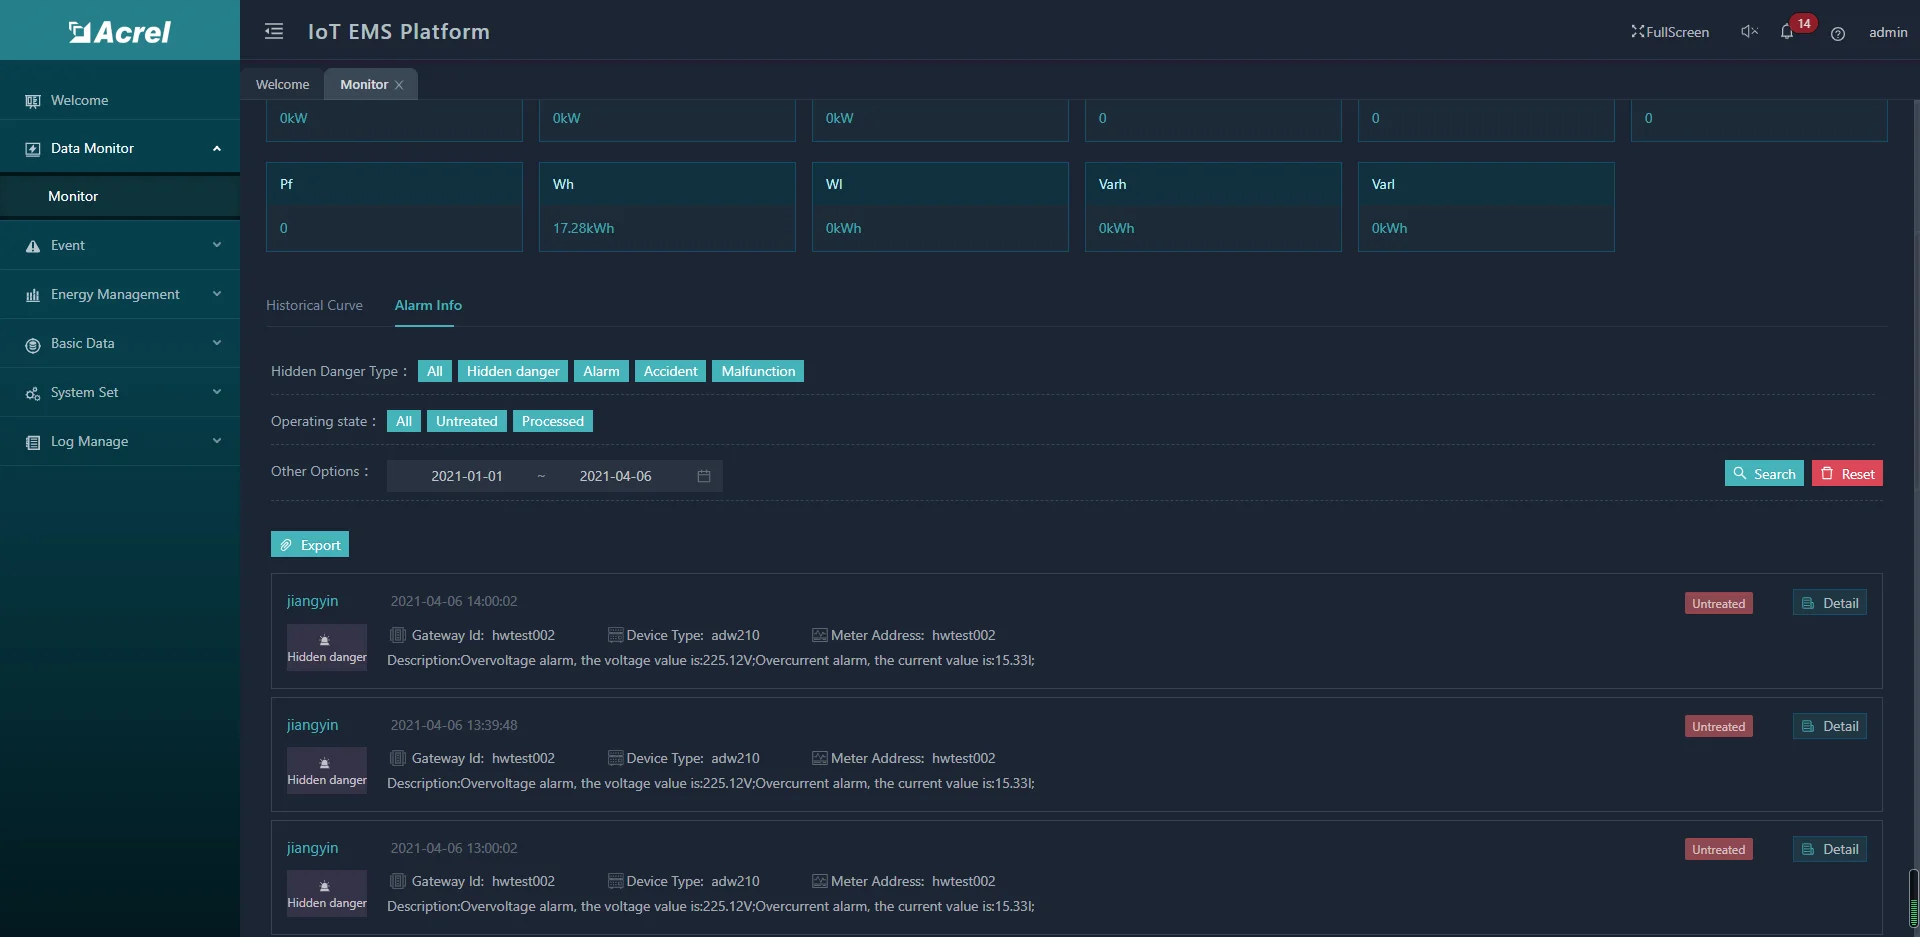
Fig. 3-4 Alarm Info Interface
4.Energy Management
Energy management includes energy overview and energy report.
1. Energy Overview
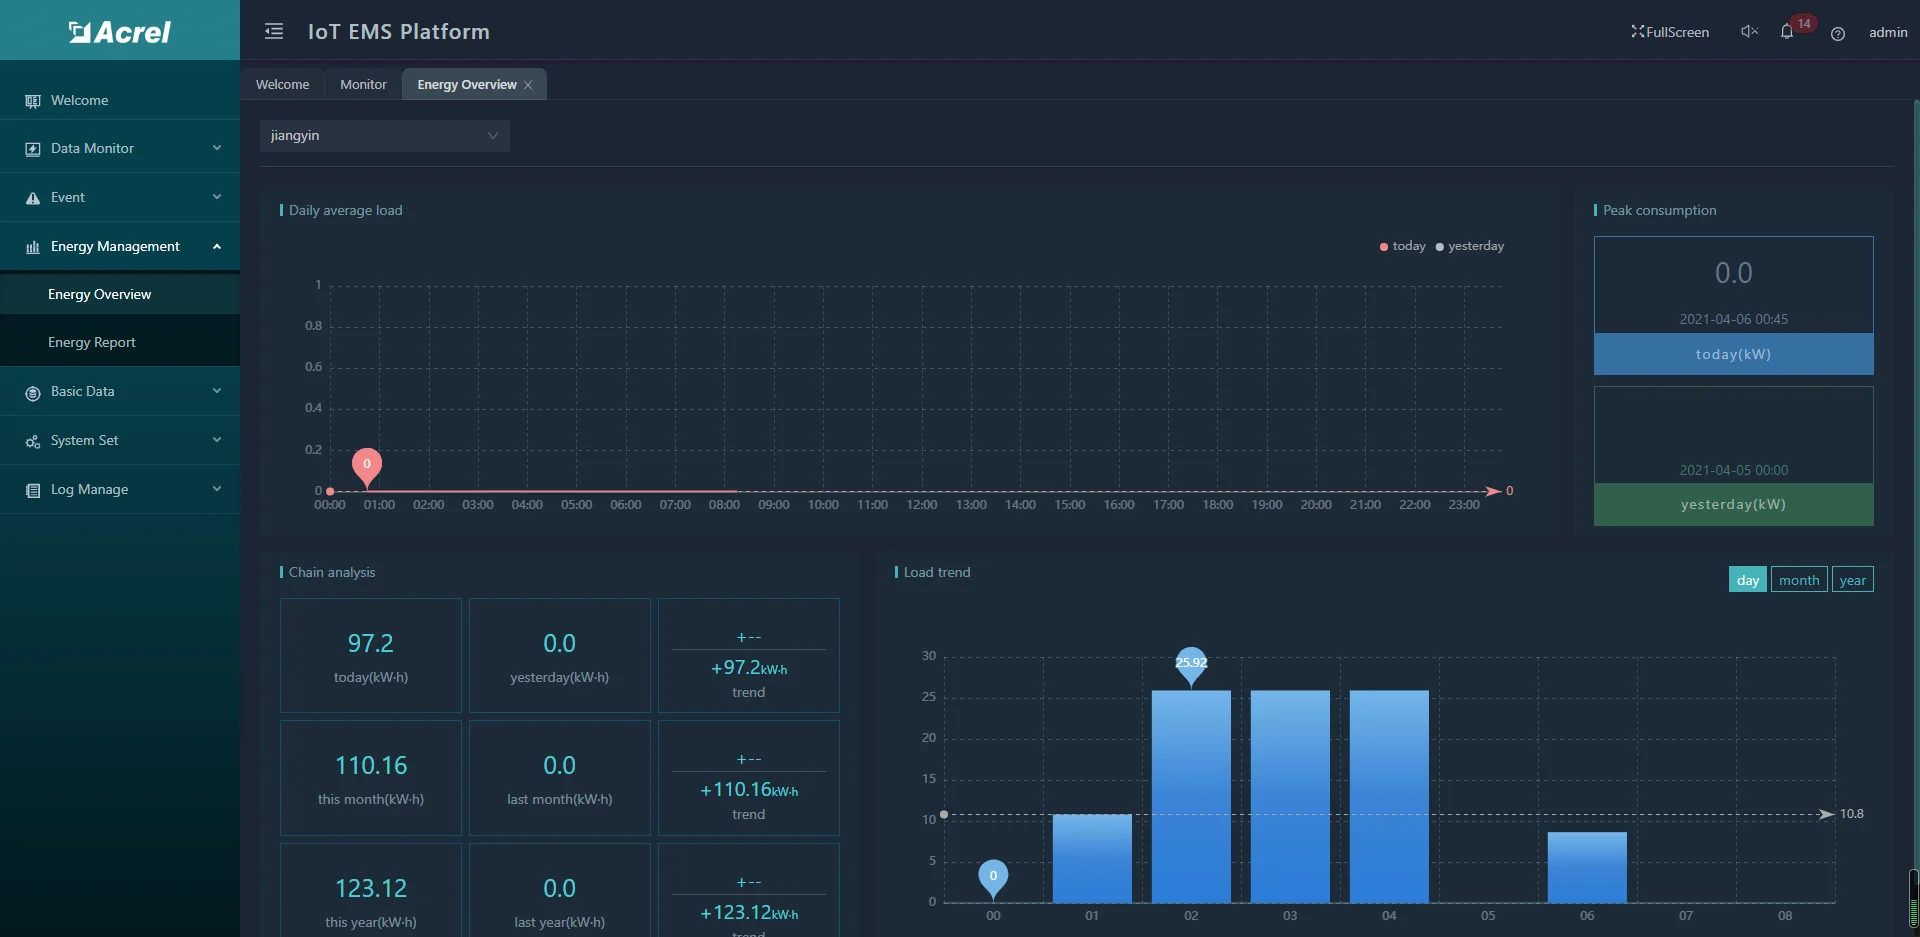
Energy overview can view the electricity consumption of today, this month, and this year, and can display the corresponding same-month-on-month information, and you can also view the peak electricity consumption of today and yesterday. The energy overview interface is as shown in Fig. 4-1.
2. Energy Report
Users and administrators can view the energy report of one or more devices.The dimensions of the report are day, week, month,quarter and year. And you can export the energy report. The energy report interface is as shown in Fig. 4-2.